- 01Do more trades mean more tax?
- 02The breakdown of 20.315% in a specified account
- 03In an account with withholding, tax is taken out every time you sell
- 04What tax deferral is
- 05Running the numbers at 10% a year for 20 years
- 06In my own calculation, 28% became about 21.5%
- 07NISA is tax-free, but the annual investment quota does not come back
- 08Loss offsetting and carryforward in losing years
- 09The special defense income tax from 2027
- 10Research on fees and spreads
- 11Common mistakes and pitfalls
- 12What to check before you start
- 13Frequently asked questions
- 14Official sources I referred to
- 15Summary
Good morning, this is まさきん.
Swap holdings every month, or buy and hold? I was designing a rotation-style rule for part of my assets and ran the numbers with taxes included. The relationship between trading frequency and taxes then came into view in a slightly different shape than I had expected.
People often say “switching loses money.” But you cannot tell what loses how much until you put it into numbers. So I am leaving a record of my calculations on the 20.315% in a specified account and on tax deferral.
Note: This information is current as of publication. Please check the official sites for the latest conditions.
- The tax rate on capital gains in a specified account (tokutei koza) is the same 20.315% no matter how many times a year you sell
- The difference comes not from the number of trades itself but from whether you can carry unrealized gains into later years untaxed (tax deferral)
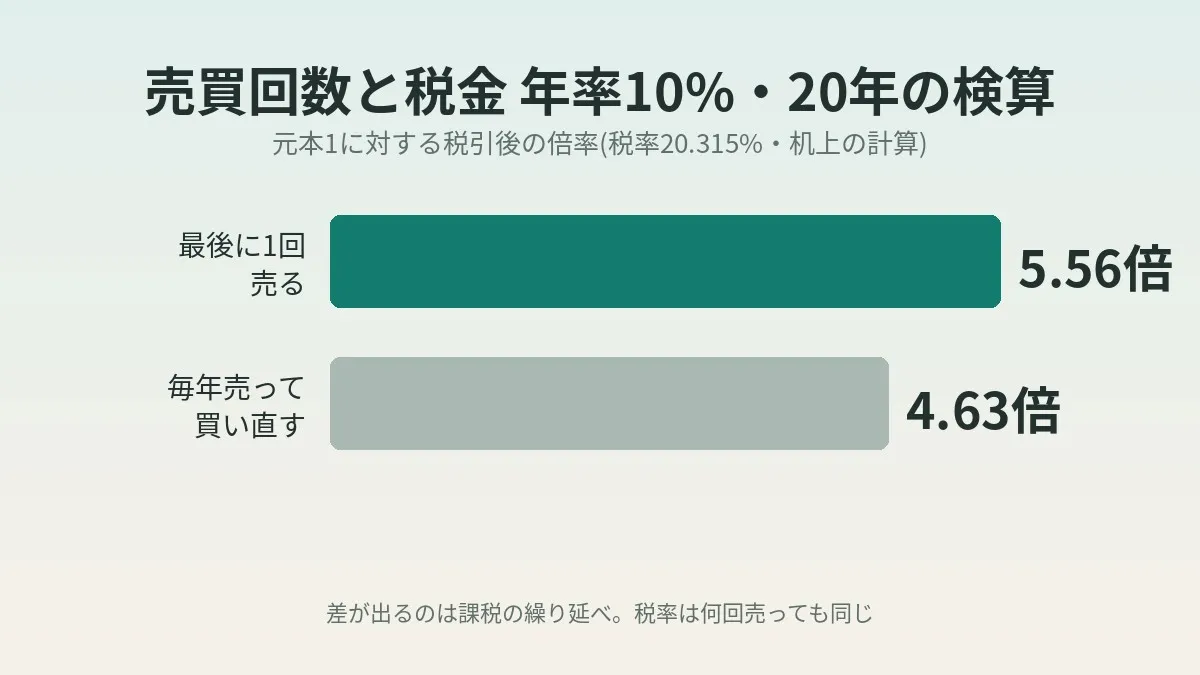
- In a simple calculation at 10% a year for 20 years, selling once at the end gives 5.56x , while selling and rebuying every year gives 4.63x
- The gap between “10 times a year” and “once a year” is small; the big gap comes from “whether you keep holding across years”
- NISA is tax-free even when you sell, but selling does not give back that year’s annual investment quota
Do more trades mean more tax?
I will give the answer first. Trading more often does not raise your tax rate. There is no extra tax tied to the number of trades either.
The tax rate on gains is the same whether you sell once or ten times. If the annual gain is the same, the tax you pay that year is roughly the same too.
So why do people say “switching loses money”? The reason is that every time you lock in a gain, tax is taken out and your capital shrinks. You then run the next investment with the reduced capital. That was the heart of it.
The breakdown of 20.315% in a specified account
First, a check on the tax rate. The National Tax Agency’s Tax Answer says capital gains on listed stocks and the like are subject to separate self-assessment taxation. It is a method calculated separately from other income such as salary.
| Component | Rate | Notes |
|---|---|---|
| Income tax | 15% | Capital gains on listed stocks and the like |
| Special reconstruction income tax | 0.315% | 2.1% of the income tax amount |
| Resident tax | 5% | |
| Total | 20.315% | The sum of the three above |
The National Tax Agency’s page does not state the total figure of 20.315% directly. It is written as “15.315%, plus 5% resident tax.” The total is a number I got by adding.
On a gain of ¥1,000,000, the tax comes to about ¥203,000. What stays in hand is about ¥797,000.
In an account with withholding, tax is taken out every time you sell
Next is when the tax is taken. This is the center of the story this time.
In a specified account with withholding, tax is deducted on each sale. The National Tax Agency’s explanation also says tax is withheld each time a transfer is made. You can make a tax return unnecessary.
In other words, if you sell while in profit, your capital shrinks on the spot. Only after-tax money can go into the next thing you buy.
On the other hand, the rise in value while you hold without selling is an “unrealized gain.” Unrealized gains are not taxed until you sell. The whole thing, including the tax portion, keeps working in the market.
What tax deferral is
This effect of “no tax until you sell” is called tax deferral.
The important point is that the tax does not disappear. Even if you keep holding, when you finally sell, 20.315% applies to the entire gain. Only the timing of payment shifts later.
However, while it is shifted, the money for the tax portion keeps growing too. It is like being able to invest money you are due to pay the government, interest-free. The longer the period, the bigger this effect.
I had misunderstood this. It is not that “more trades mean heavier tax.” I think the accurate way to put it is “if you lock in gains every year, you give up the deferral effect yourself.”
Running the numbers at 10% a year for 20 years
Assumptions
To check with numbers, I built a simple model. The assumptions are as follows.
- Principal is 1, with no dividends
- The pre-tax rate of appreciation is constant every year
- The tax rate is 20.315% and fees are zero
- There are no losing years
I compared three patterns.
- Sell only once at the end (buy and hold)
- Sell everything and rebuy once every year
- Rotate 10 times a year (assuming tax is deducted on each sale)
Real price movements are not constant. So this is a paper calculation meant only to compare the taxation of gains on sale. Let me say up front that it does not indicate future performance.
5.56x selling once at the end, 4.63x selling every year
Here are the results. The figures are after-tax multiples of a principal of 1, with the after-tax annual rate in parentheses.
| Annual rate and period | Pre-tax | Sell once at the end | Sell once a year | Rotate 10 times a year |
|---|---|---|---|---|
| 7%, 10 years | 1.97x | 1.77x (5.88%) | 1.72x (5.58%) | 1.72x (5.54%) |
| 7%, 20 years | 3.87x | 3.29x (6.13%) | 2.96x (5.58%) | 2.94x (5.54%) |
| 10%, 10 years | 2.59x | 2.27x (8.54%) | 2.15x (7.97%) | 2.14x (7.90%) |
| 10%, 20 years | 6.73x | 5.56x (8.96%) | 4.63x (7.97%) | 4.57x (7.90%) |
| 28%, 10 years | 11.81x | 9.61x (25.39%) | 7.49x (22.31%) | 7.19x (21.80%) |
| 28%, 20 years | 139.38x | 111.27x (26.57%) | 56.15x (22.31%) | 51.63x (21.80%) |
At 10% a year for 20 years, selling once at the end gives 5.56x . Selling and rebuying every year gave 4.63x. Starting with ¥1,000,000, that is a difference between about ¥5,560,000 and about ¥4,630,000. As a proportion, it is a gap of about 20%.
At 7% a year for 10 years, the gap stays at about 3%. The higher the return, the wider the gap. The same was true for longer periods.
The gap between 10 times a year and once a year is small
What surprised me most in the table was the two columns on the right: selling once a year, and rotating 10 times a year. The gap between these two is only about 0.04 to 0.5 points in annual rate.
The big gap is between those and the column to their left. In other words, “10 times a year or once a year” does not matter much. What mattered was “whether you carry unrealized gains across years.”
I noticed one more thing. When you sell every year, the after-tax annual rate is constant regardless of the period. As a formula it is “annual rate × (1 − 0.20315),” which is 7.97% for 10%.
Selling once at the end is different. The longer the period, the closer the after-tax annual rate gets to the pre-tax rate. It is 8.54% over 10 years and 8.96% over 20 years. I think this is the deferral effect itself.
Note that this table does not include costs such as the spread incurred on every trade. Include them and the figures for the rotation style drop further. The 10-times-a-year column assumes tax is deducted on each sale. With an account without withholding, where you pay the following year, it comes closer to the sell-once-a-year column.
In my own calculation, 28% became about 21.5%
From here it is about me. For part of my assets, I designed a “monthly rotation” rule that switches into the top-ranked holdings every month. I have been testing that rule against past data.
The annual rate in the calculation without taxes was 28%. But once I put taxes in, on the assumption of trading about 10 times a year, it dropped to about 21.5%. The drop has almost the same shape as the 28% rows in the table above.
This 28% and 21.5% are paper calculations fitted to past data. They are not actual investment results. Nor do they guarantee future results. Keep in mind that a rule that looks good on past data will not necessarily behave the same way going forward.
The “roughly twofold gap at 28% over 20 years” in the table is also the result of an extreme assumption. I do not think 28% a year continuing for 20 years is realistic. More than the size of the numbers, it is the mechanism that creates the gap that I want to keep in view.
I dropped the rotation style and switched to buy and hold
Seeing this calculation, I decided to drop the rotation style. I am switching to buying a fixed amount every month and holding.
I also redid my selling rule. I sell only when something has risen a lot, and only part of it. Selling everything to swap was removed from the rules.
The reason is simple. What I give up by losing deferral was easier to read than what rotation might add. Whether the added return materializes is unknown. The reduction from tax happens for certain as long as there are gains.
This is strictly my own decision. The same conclusion will not necessarily suit everyone. I hope you will take it as material for thinking.
The point that once you decide, you no longer have to lift a finger is similar to a fixed cost review. With communication costs like a phone bill too, one review keeps paying off every month.
Clicking this opens the Rakuten login page. Once you log in, you’ll see the campaign details.
NISA is tax-free, but the annual investment quota does not come back
It is tempting to think “then just do the rotation inside NISA.” Inside NISA, there is no tax when you sell. The problem of capital shrinking with each sale does not arise.
However, NISA has a different constraint: the annual investment quota. According to the Financial Services Agency, the Tsumitate investment quota is ¥1,200,000 a year. The Growth investment quota is ¥2,400,000 a year. Together, the limit is ¥3,600,000 a year.
This quota is used up every time you buy. Selling does not give it back within that year. The Japan Securities Dealers Association’s Q&A also says an annual investment quota once used cannot be used again in that year.
| Item | Specified account (with withholding) | NISA |
|---|---|---|
| Tax on gains from sale | 20.315% | Tax-free |
| What shrinks when you sell | Capital shrinks by the tax | Capital does not shrink |
| Constraint on rebuying | None in particular | Uses up more of that year’s annual investment quota |
| Quota for what you sold | No concept of a quota | Restored from the following year, by the book value only |
| Treatment of losses | Eligible for loss offsetting and loss carryforward | Not eligible |
What is restored the following year is the book value of the product you sold. Book value is the amount at purchase, so the appreciation does not come back. The restored portion can also only be used within the following year’s annual investment quota.
So if you rotate monthly in NISA, the quota runs out first. You may become unable to rebuy within NISA that year. The tax-free quota seems a better match for things you hold for a long time.
Loss offsetting and carryforward in losing years
The calculation does not consider losing years. In reality, there are years when prices fall.
According to the National Tax Agency, capital losses on listed stocks and the like can be offset by filing a tax return. They are offset against that year’s dividend income and the like from listed stocks. Losses that cannot be fully offset can be carried forward for the following three years.
To carry a loss forward, you need to file a tax return for the year of the loss. You also need to file continuously in the years after. That you have to file even in a year with no trades is easy to overlook.
When there are losing years, there are also situations where tax goes down. So the actual gap may be smaller than in the table. For the detailed handling of losses in an account with withholding, the surest way is to check the explanation from the brokerage you use.
The special defense income tax from 2027
One more note on tax rates. A special defense income tax is set to begin with income for 2027.
The Ministry of Finance’s tax reform outline says the following. The special defense income tax is calculated by multiplying the income tax amount by 1%. At the same time, the special reconstruction income tax rate falls from 2.1% to 1.1%.
Added together, it is still 2.1%. So the total tax rate on capital gains is expected to stay at 20.315%. What changes is the names in the breakdown and how long the surtax continues. The period of the special reconstruction income tax has been extended to 2047.
However, I have not been able to confirm an official page that explicitly states the total rate from 2027 onward. The figures above are my calculation from the outline. Please check the actual rate in the National Tax Agency’s guidance at that time.
Research on fees and spreads
Separately from tax, there is research showing that the more you trade, the less you take home. It is a paper published by Barber and Odean in 2000. They examined the accounts of about 66,000 US households from 1991 to 1996.
The annual return after costs was 11.4% for the households that traded the most. For those that traded the least it was 18.5%. Before costs, there was reportedly almost no difference in performance. However, what this research measures is fees and spreads. It is not about tax. And since it is US data from the 1990s, I do not think it applies directly to Japan today. I read it as supporting evidence that repeated trading reduces your take-home through another route as well.
Common mistakes and pitfalls
Here are the points I nearly fell into myself while running the numbers.
- Judging whether a rotation rule is good or bad by looking only at the pre-tax annual rate
- Mistakenly believing that “trading less lowers the tax rate”
- Thinking any number of swaps is fine in NISA and using up the annual investment quota
- Not filing a tax return in a losing year and missing out on the loss carryforward
- Treating results calculated on past data as a forecast for the future
- Being so reluctant to pay tax that you cannot fix a lopsided portfolio
The first one in particular seems likely to happen when you are looking at a backtest screen. That is because pre-tax numbers look good.
There was a period in the past when I was switching every month in my corporate DC plan. I wrote my look back on that in what happened when I switched every month in a corporate DC plan. The urge to feel like I am investing by doing something with my hands may have been the same this time too.
Holding on also has a weak point. Even when the portfolio becomes very lopsided, you become unable to sell because of the tax. That is why I kept the rule “sell only part when something has risen a lot.” I did not want to leave excessive risk in place because of tax.
I wrote about where to keep money you will use soon in working backward from the largest expected expense to size your emergency fund. It may be worth a look alongside this, as the foundation before putting money into investments.
What to check before you start
- I checked whether the account I invest in is a specified account or NISA
- For a specified account, I checked whether it is with or without withholding
- I checked whether the calculated or projected figures are pre-tax or after-tax
- I counted roughly how many times a year I lock in gains
- I checked how much of my NISA annual investment quota is left
- I checked the conditions for filing a tax return and carrying losses forward in a losing year
- I decided my selling rule in advance
- I checked the latest tax rates and rules on the official pages of the National Tax Agency and the Financial Services Agency
Frequently asked questions
Q. Does the tax rate go up if I trade more often?
No. The tax rate on capital gains on listed stocks and the like is 20.315% regardless of the number of trades. Where the difference arises is in when you lock in the gains.
Q. With tax deferral, do I get out of paying the tax?
No. When you finally sell, the whole gain is taxed. The effect is that the timing of payment shifts later, and the tax portion can also stay invested in the meantime.
Q. If I sell only once a year, is the loss small?
In my calculation, the gap between once a year and 10 times a year was on the small side: about 0.04 to 0.5 points in annual rate. The big gap was between selling every year and holding for many years.
Q. Does switching always lose money?
Not always. If the extra return gained from switching exceeds what is lost to tax and costs, you come out ahead. However, the extra return is uncertain. The reduction from tax happens for certain as long as there are gains.
Q. In NISA, is it fine to trade as many times as I like?
There is no tax, but you use the annual investment quota every time you buy. Selling does not give back that year’s quota. What is restored from the following year is the book value, and it can only be used within the annual investment quota.
Q. Can losses in NISA be offset against gains in a specified account?
No. According to the National Tax Agency, capital losses within a NISA account are not eligible for loss offsetting or loss carryforward.
Q. Will the tax rate go up from 2027?
Calculating from the Ministry of Finance’s outline, the total is expected to stay at 20.315%. That is because a 1% special defense income tax is added while the special reconstruction income tax falls to 1.1%. Please check the finalized details in the National Tax Agency’s guidance.
Q. Is the gap large even when returns are low?
It gets smaller. At 7% a year for 10 years, the gap was about 3%. The gap widens when returns are high and when the period is long.
Official sources I referred to
- National Tax Agency | No. 1463 Taxation on the transfer of stocks and the like (separate self-assessment taxation)
- National Tax Agency | No. 1476 The specified account system
- National Tax Agency | No. 1474 Loss offsetting and carryforward of capital losses on listed stocks and the like
- Financial Services Agency | Learn about NISA
- Financial Services Agency | For everyone using NISA
- Japan Securities Dealers Association | Q&A on NISA from 2024 onward
- Ministry of Finance | Tax reform outline (tax measures to secure funding for strengthening defense capabilities)
- Barber and Odean (2000) Trading Is Hazardous to Your Wealth
Summary
The relationship between trading frequency and taxes turned out not to be about frequency. The tax rate in a specified account is 20.315% no matter how many times you sell. What creates the gap is whether you can carry unrealized gains forward untaxed.
In the calculation at 10% a year for 20 years, selling once at the end gave 5.56x. Selling every year gave 4.63x. Seeing these numbers, I decided to switch from the rotation style to buy and hold.
How to come up with the money to invest in the first place is covered in how I lowered my phone bill and put the savings into the new NISA.
Taxes and rules can change. Please make your final decision after checking official information and consulting a professional such as a tax accountant. Why not review your own rule, just once, using after-tax numbers?
Just like cutting down the number of moves in investing, communication costs take no effort once you have decided. Take a look at your monthly fixed costs while you are at it.
Clicking this opens the Rakuten login page. Once you log in, you’ll see the campaign details.
This article contains affiliate advertising. If you sign up for a product or service through a link on this site, we may receive compensation from the partner company. The site operator is also an employee of Rakuten Group and may receive compensation through an employee referral program. The content and opinions here are based on the operator’s own experience and research regardless of any advertising relationship, but please read with the above in mind. See the Disclaimer & Affiliate Disclosure for details. Disclaimer & Affiliate Disclosure
This article includes machine-translated content. Please check the official Rakuten Mobile multilingual page for exact terms.
If you have concerns about Rakuten Mobile coverage or signal quality, you can consult through the official signal improvement request form .